We make use of optical techniques, genetic tools, and processing algorithms developed by other members of the lab to determine how populations of neurons act in concert to represent the external world. Our lab’s intersectional expertise enables us to record the activity of large populations of neurons in many regions of the brain. We employ a wide range of tools including:
-
Calcium and voltage sensors
-
1-photon and 2-photon imaging/stimulation
-
Computational modeling
-
Fiber Photometry
-
Virtual Reality
One of the brain regions we are interested in studying is the hippocampus, a region of the brain that contributes to the brain’s perception of space through a population of spatially tuned neurons called place cells. We optically capture the activity of hundreds of place cells under wide-field imaging as mice behave in virtual reality over a period of weeks to months. From individual recordings we determine how sensory modalities, such as vision and self-motion, shape the current representation of space in the hippocampus. From a temporal series of recordings, we quantify how the representation of space evolves through time and experience within a population of place cells.
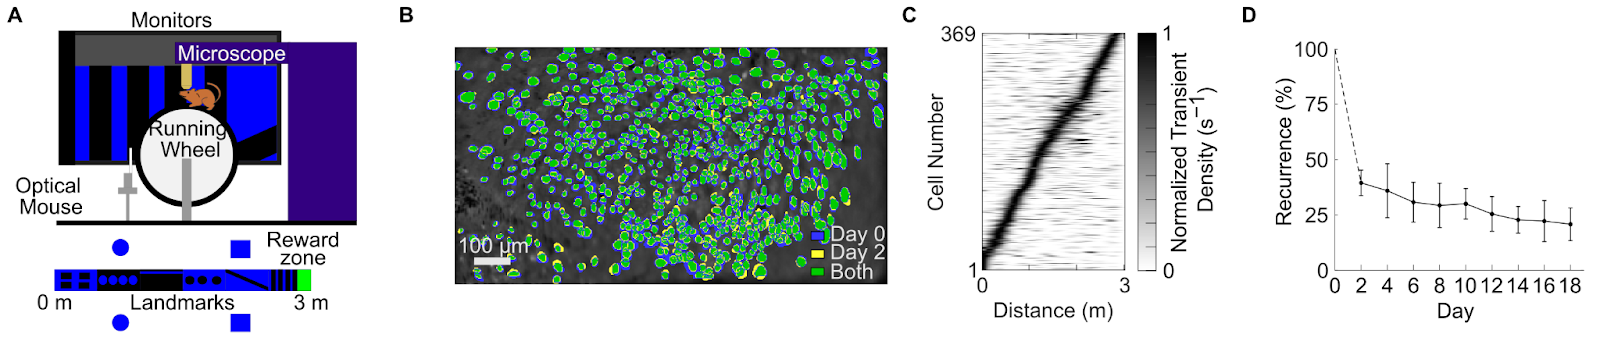
A. Top: Schematic of the optical recording and VR setup. Bottom: Map of the virtual environment. Mice received water reward for pausing 0.5 s within a reward zone at the end of a 3 m infinitely looping hallway.
B. Merged field of view showing common neurons identified from two days of recording. Pixels identified as belonging to a neuron on only day 0 (blue) or day 2 (yellow) make up the minority of merged neuron pixels. The high proportion of green reflects the accuracy of our registration and consistency in neural activity through time.
C. Spatial activity of place cells recorded while mice moved through the virtual environment in (A). The spatial activity of identified place cells tiles the entire linear track.
D. Percent recurrence of place cells identified on day 0 from ~3 weeks of recording. Recurrence shows an initial sharp drop-off from day 0 to day 2 followed by a much more gradual decrease.